Understanding Bus Bar Ampacity Charts
This article presents a brief overview of ampacity charts for both copper and aluminum bus bar, and shows how to interpret the data within. However, these charts can only tell you so much. There are a number of considerations that need to be recognized beyond the figures given in the chart. Also, as always, the engineers at Storm would like to remind bus bar designers that ampacity charts are a great guide, but one cannot guarantee that a part will perform as estimated until the part has undergone actual thermal testing and analysis.
For reference, please see Ampacities of Copper Alloy C11000 Bus Bars or Aluminum to Copper Ampacity Comparison Chart
What is an Ampacity Chart?
It turns out that ampacity is a combination of the words ampere and capacity. An ampere is a unit that describes the level of electrical current carried by the conductor material. So, as implied by the name, an ampacity chart (sometimes called an ampacity table) is a tool used by engineers to quickly calculate the maximum amperage capacity of a specific thickness of bus bar. Instead of doing the math from scratch, the ampacity chart conveniently provides important data for each thickness, namely the expected resistance per foot and the amount of expected heat rise.
How to Use an Ampacity Chart
So, you want to determine the appropriate bus bar thickness to carry a specific level of electrical current? First, what amperage does the conductor need to carry? What type of current: Direct Current (DC) or Alternating Current (AC)? What kind of conductor material do you want to use? For the material question, see this article that discusses the differences and potential cost savings when deciding between copper and aluminum bus bar .
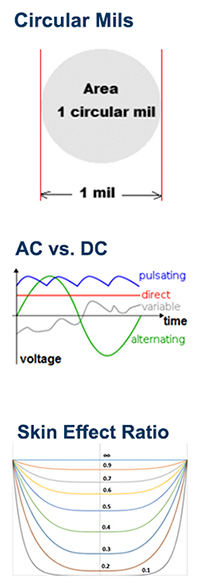 Circular Mils
If you look under the “Area” column, you’ll see two different units of area: square inches and circular mils. The discussion of circular mils necessitates a quick history lesson. Before copper bus bar became the power transfer component of choice, wires were king in the the power distribution industry. Therefore, the ampacity chart is still based on the mathematical language developed around wiring. Wires can be broken down into circular mils (a reference to the area of a circle in thousandths of an inch), where the greater a wire’s gauge/thickness means the more circular mils that are contained in that wire. Bus bars, however, are not circular, but square. As a nod to those who continue to deal with wires, the ampacity chart includes a handy conversion between the square inch area of bus bars and the circular mils of wiring. For example, a 1/16 x 1/2 inch bus bar has an area of 0.0312 inches square, and the equivalent circular area of 39.7 circular mils.
AC vs. DC Current
When dealing with DC power, the biggest concern is resistance per foot and the resulting voltage drop. In other words, we don’t want the resistance in the bus bar to be so high that there’s not enough electrical power at the other side. This isn’t such a concern with short bus bars, but as the bar becomes longer, it can become a serious issue. The heading that applies to this in the ampacity chart is “DC Resistance At 20° C, MicroOhms/Ft.” This heading is saying, “At 20° C ambient temperature, you can expect the resistance to be this many microOhms per each foot of bus bar.” MicroOhm meaning one millionth of an Ohm, where an Ohm is a measure of impedance and thus resistance. We can note on the chart that the thinnest copper busbar has a lot of resistance (264.0 MicroOhms/ft), but as the thickness increases, the resistance drops dramatically.
The major concern with AC power is when heat rise becomes an issue. The last three columns of the chart deal with the expected heat rise in Celsius, based on the thickness of the bus bar and the amperage flowing through it. For example, if you use a 1/16 x 1/2 inch bus bar at 136 amps, you can expect to see a 50° C rise from ambient temperature. It is important to note that this calculation is assuming the frequency of the AC power is 60Hz. As the frequency increases, the heat rise will increase as well, and vice versa.
Skin Effect Ratio
The last heading to discuss is the skin effect. In straightforward terms, the skin effect is the tendency of electric charge to travel closer to the surface of a conductive material than its interior. For copper, most of the power is carried within a fraction of the bus bar surface. The skin effect only occurs with AC power, since the cause is the magnetic field produced by the alternating polarity of AC. The skin effect causes increased resistance at increased frequencies. The skin effect ratio tells us how much additional resistance is experienced because of the AC skin effect versus the resistance that would otherwise occur in the comparable DC system. Put simply, the higher the skin effect ratio, the higher the resistance caused just by the presence of AC power compared to DC power.
Important Considerations Ampacity Charts Will Not Display
There are a few scenarios not covered by the ampacity chart that need to be considered when it comes to resistance and heat management.
Work Hardened Metal
The harder the copper (or aluminum, etc), the worse it becomes at carrying a current. This comes into play as the metal is hardened by rolling, stamping, bending or hole punching. The material around these bends and holes becomes work hardened, and the increased resistance will skew the estimations provided by the ampacity chart.
Mutual Proximity & Chimney Effect
Air cooling works via convection. That is, heat is dissipated from bus bars through air currents buffeted by heated air rising and cooled air dropping. However, if parts are too close to each other, it inhibits the convection cooling process. Or, say three bus bars are arranged parallel to each other in close proximity. The middle component will have less opportunity to dissipate its heat, since the other two parts are blocking the convection airflow and preventing the ambient air from sufficiently cooling. Furthermore, the chimney effect describes the scenario where arranging parts vertically on their edge, rather than horizontally flat, increases the efficiency of convection cooling. Basically, the greater vertical surface area allows the rising hot air to take more heat with it.
Physical Performance Analysis
Most importantly, remember that the ampacity chart is simply a quick guide. One can never be completely sure how a part will perform until it undergoes thorough performance testing. Fortunately, Storm has a full suite of testing capabilities to properly gauge the thermal and voltage performance of any part.